Probability Statistics for Us Dime Nerds

Sleepy Holow

Bronze Member
Feb 2, 2013
1,043
876
Expanding Operations
Detector(s) used
Never used one, but am interested
Primary Interest:
Other
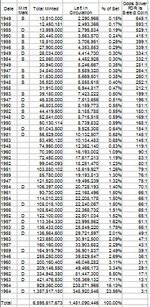
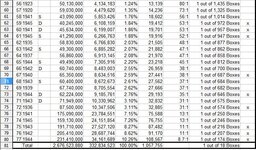
So I was crunching some numbers concerning the probability of me filling another hole in my FDR folder. So I calculated the probability of a silver FDR find being a certain date and mint. I love taking data and making spreadsheets. All of my data is based on known mintage numbers. The odds of an random silver FDR find being a 1964D are 4:1 while the odds of the same unknown coin being a 1955 are a staggering 529:1.

Some known sources of error include people hoarding key dates, 1964 dimes having had the least amount of time to disappear in the 1946-1964 set, and not actually knowing how many of each date/mint are still in existence.

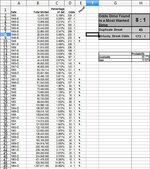
If you add up the probabilities of finding each hole left on the Most Wanted List, it comes out to about a 10.83% chance of finding one of them each time I come across a silver FDR. Not too bad...8:1 odds. So all I've got to do is find 9 dimes and I should be able to fill a hole! Or at least that's what was supposed to happen. I haven't been able to fill a hole for about a month now. That's no new FDR finds in the last 45 Silver FDRs. Well, if we take into account that there's an 89.17% chance that the found FDR is a duplicate, then the probability of this occurring 45 times in a row is 0.8917^45, or 173:1 odds. By my calculations, that's crazy unlucky! Hmmm..173:1 is good enough to break into the Top 15 toughest silver FDRs odds. Do I have a Top 15 Dime coming this week? Maybe, maybe not, BUT MAYBE! You never know what the next box will bring my friends...HH :sleepy2:

Probability Pic.jpg
For Your Viewing Pleasure: Silver FDR Dime Probability Chart
 

Upvote 0
OP
OP
Sleepy Holow

Sleepy Holow

Bronze Member
Feb 2, 2013
1,043
876
Expanding Operations
Detector(s) used
Never used one, but am interested
Primary Interest:
Other

GMan00001

Silver Member
Dec 19, 2006
2,536
224
Twin Cities, MN
Detector(s) used
Garrett Ace 250
Primary Interest:
All Treasure Hunting
I don't know what the correct percentage should be, but I have a couple thoughts. First, it's probably not likely to be a constant % over time, year by year. All I could really feel comfortable saying is that it probably does increase every year.

Second, even though the number of each given silver dime in circulation is likely decreasing year after year, I have to think that an important factor is dimes coming back in to circulation that had been out of circulation for some time. Personally I think the likelihood is that almost any silver dime you find today in CRH was probably part of a hoard/collection at one point, and for whatever reason (death, accidental dump, theft, etc.) was dumped at a bank or spent, probably sometime fairly recently. It would be cool if there was a way to know how long a given coin had been in circulation.

Anyway, my point is that if X number of a given dime are taken out of circulation each year, that is offset by Y number of that same dime that find their way back in to circulation. Y is almost certainly less than X.

I don't disagree with most of what you said. I realize that my factors are oversimplifications of reality, but all we are trying to do is get to an estimate of how long it would take on average and for that purpose they are decent. You could add another factor called "collectability" as rarer coins were more likely to be removed from circulation even when all dimes were silver. This factor is probably more likely than my Factor #1

The only point I "might" disagree with is the definition of what "in circulation" means. I consider a coin still in circulation if its owner has not intentionally pulled the coin into a collection. Now the coin might sit in someone's change jar for 35 years before being cashed in, but I say that is still technically "in circulation" and therefore I disagree that almost all silver dimes were a part of a collection or hoard at one point. I suspect a number of them were just in change jars that didn't get cashed in frequently and if it goes from one change jar that has a slow cycle to another, it wouldn't be that difficult for a coin to go 50-100 years with only being circulated a few times and yet never be in a "collection/hoard".

I think there are many people who only cash in change every year or every few years so I don't think it it is too unlikely.
 

sagittarius98

Gold Member
Jan 16, 2012
5,932
753
Maryland
Detector(s) used
White's Coinmaster
Primary Interest:
Other
Factor #2
A percentage of the coins minted each year were removed/lost and that with each passing year a percentage is also removed/lost which repeats each year after the coin is minted. So a coin from 1964 had X% removed/lost and 1963 had 2X% removed/lost and 1962 had 3X% removed/lost and so on. Essentially this is trying to represent making coins harder as they get older. What is the percentage 1%? 0.01%?

It's really hard to create probability statistics due to all the factors.

You have to keep in mind that some of the lost dimes will get recovered if they were buried in the ground by metal detectorists. Meanwhile, others that were lost in houses or in areas that can't be detected may not be recovered for centuries. Also, you have to calculate the ration of removal to return. It gets harder too because that ratio changes due to other factors. At the beginning (1965-1967), the rate of removal was far greater, since people knew about the transition to clad from the news and were culling silver. The people that were going to deposit silver were more informed, so few people deposited it. Once the majority of the silver was culled, the ratio must have been almost even. The younger generation did not know about silver, and the price was low enough they would probably not care. More silver got dumped, and less got culled. Since the past few years, the ratio has increased toward removal again. The price of silver and the advertisements for CRH have increased new competition. Even if they quit, they will probably remember about silver and will continue culling from change and will inform their family/friends about silver. Once the price of silver falls again to the low teens, there will be fewer new CRHers and a closer to even ratio once again.
 

BuffaloBoy

Gold Member
Feb 16, 2011
8,176
1,634
America
Primary Interest:
All Treasure Hunting
hey awesome post! i might have to go through my silver dimes and do one of these too! I know I have a few rarer roosies. :)
 

OP
OP
Sleepy Holow

Sleepy Holow

Bronze Member
Feb 2, 2013
1,043
876
Expanding Operations
Detector(s) used
Never used one, but am interested
Primary Interest:
Other
Okay, so here's what I was able to get done tonight (besides go through a skunk box of dimes :tongue3:) I looked up what the mint considers the average life of a coin to be. They call it 25 years, so I'm going to base my model on. So I went and solved x^25=0.5 (25 being the years and 0.5 being the top of a bell curve aka the average) and got x=0.97265494741. Important number! I shall call it the "Circulation Constant". Sag made a good point that rate of removal will vary based on a number of circumstances, but in an effort to find a starting place I'm going to say Circulation Constant = 1 - Rate of Removal. In this case, Rate of Removal is 0.0273450526, or 2.734% of a particular date removed from circulation each year. With this in mind, I went ahead and applied this formula to each Silver FDR date:

Left in Circulation = Total Minted * Circulation Constant^(2013-year minted).

For example, for a 1963D it would read 421,476,530 minted * 0.97265494741^(2013-1963) = 105,369,132 Silver Ag left in Circulation. Okay, okay...before you blast me with "There's no way there's that much in circulation right now!" I agree 100%...Obviously people are removing silver at a higher rate than "the natural life of a coin". I'm going to take this model further when I get the chance tomorrow. Just wanted to show you guys what you inspired so far...Oh, and here's my updated model.

Probability Pic2.jpg
 

boristhespider88

Bronze Member
May 10, 2012
1,947
612
Primary Interest:
Other
Okay, so here's what I was able to get done tonight (besides go through a skunk box of dimes :tongue3:) I looked up what the mint considers the average life of a coin to be. They call it 25 years, so I'm going to base my model on. So I went and solved x^25=0.5 (25 being the years and 0.5 being the top of a bell curve aka the average) and got x=0.97265494741. Important number! I shall call it the "Circulation Constant". Sag made a good point that rate of removal will vary based on a number of circumstances, but in an effort to find a starting place I'm going to say Circulation Constant = 1 - Rate of Removal. In this case, Rate of Removal is 0.0273450526, or 2.734% of a particular date removed from circulation each year. With this in mind, I went ahead and applied this formula to each Silver FDR date:

Left in Circulation = Total Minted * Circulation Constant^(2013-year minted).

For example, for a 1963D it would read 421,476,530 minted * 0.97265494741^(2013-1963) = 105,369,132 Silver Ag left in Circulation. Okay, okay...before you blast me with "There's no way there's that much in circulation right now!" I agree 100%...Obviously people are removing silver at a higher rate than "the natural life of a coin". I'm going to take this model further when I get the chance tomorrow. Just wanted to show you guys what you inspired so far...Oh, and here's my updated model.

View attachment 840948

Wow, that's great mathin' you got going on here!

If my college stats class was this interesting, I might've actually given a damn, lol.
 

OP
OP
Sleepy Holow

Sleepy Holow

Bronze Member
Feb 2, 2013
1,043
876
Expanding Operations
Detector(s) used
Never used one, but am interested
Primary Interest:
Other
Alright...I've put in quite a number of hours into making this spreadsheet as good as I possibly could, so here it is:

Key Assumptions
1) Average coin lasts for 25 yrs. Source: The United States Mint · Coins & Medals
2) Exponential decay based on Left in Circulation = Total Minted * Circulation Constant^(2013-year minted) formula.

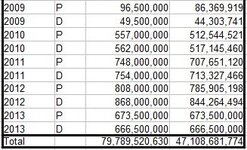
First, I tried to estimate how much clad (1965-2013) is out there base on the formula above. Figure 1 shows the tail end of my clad calculations. I got the 2013 numbers from the mint: Circulating Coins Production Figures: usmint.gov

Clad Estimate.jpg
Figure 1: Clad Estimate is over 47B.

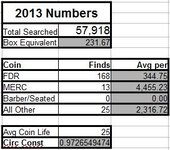
Next, I tailored this spreadsheet so whoever uses it can enter in data unique to their area. Some people say, "I do real bad with Dimes" or "My area is better for Dimes than halves". Well, if you take a look below at Figure 2, you'll noticed I've created an area on the spreadsheet where the CRHer can input his or her stats. The white boxes are variables, while the gray boxes are the results of the information entered by the CRHer. This updates the spreadsheet to give the CRHer an idea of what the odds of finding a particular dime are looking like based on their unique hunting grounds. Figure 2 shows my stats as of right now.

Amount Searched.jpg
Figure 2: Spreadsheet Customizer

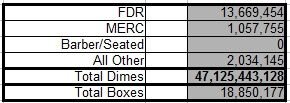
So based on the data the CRHer enters in Figure 2, the non-clad estimates shown in Figure 3 are updated to reflect a sort of "apparent" number of FDRs, Mercs, Barber/Seated, and all other (foreign, washers, plastic, etc.) left in ciculation. I say apparent because you might be in an area of the country where it appears that dimes are plentiful. Conversely, you might be in a town loaded with Dime Hunters and it appears to you that dimes are a thing of the past. Taking into account your search history, we can come close to answering the ultimate question: How long will it take me to complete my FDR set?

Estimates.jpg
Figure 3: Apparent Non-Clad Estimates

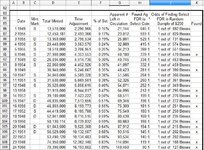
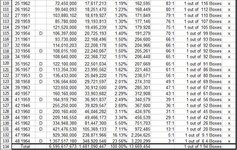
So here it is folks! The results of my model for the FDR set:
FDR1.jpg
FDR2.jpg
Figure 4: FDR Probability Findings

A couple things to highlight about Figure 4. First, the Time Adjustment column is the amount of coins that would be left in circulation had they not been hoarded. Obviously, this stat can't really have any bearing on the 1946-64 FDRs, so I had to take it a step further. Basically, I took the FDR estimate in Figure 3 based on the stats I entered for my area and got the 13.6M you see there. Then I took the 13.6M and multiplied it by the % of Set number found in Column F of Figure 4 to get the Apparent # Left in Circulation of each FDR date. Column H is the old "I just found a silver FDR...What are my chances it's a certain date?". Column J is my pride and joy! What are the odds you find a certain date given a random box of dimes? The formula for this is basically: 1/ (1 - (Total Dimes - Apparent # Left in Circulation of a Certain Date)/Total Dimes)^2500). For the probability experts out there, I did the more complicated version as well using (Total Dimes - Apparent)!/Total Dimes! and got the same results just because the numbers are so massive. Had to write a macro and everything! Anyway, for my area it seems that I would have to go through approximately 892 boxes of dimes to complete the set or $223,000. Now this may sound a little low, but here's what I think the reasoning for that is. These numbers don't necessarily take into account the fact that you WILL over time search through some of the same dimes you've dumped in the past. It's inevitable; however, I still want to stress the importance of doing your best to minimize encountering your dumped dimes. That's all I'll say about that.

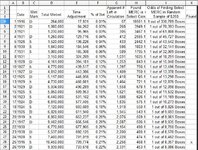
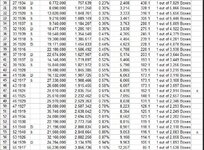
And for those that are curious about those MERC Dime odds, I present Figure 5:

Merc1.jpg
Merc2.jpg
Merc3.jpg
Figure 5: Merc Probability Findings

Once again, I'd like to point out that these odds are unique to my area only. If you want me to run your area or you want me to send you this spreadsheet, just let me know. The main thing that really pops out at me is the estimated 57 1916D's left in circulation. Basically, it's going to take a CRHing miracle to come across one of those bad boys!

Well, hey...hope you guys find this somewhat useful. If anyone has any questions about the math that I used, the logic that I used for my model, or if anyone wants me to run their numbers, I'd be happy to. I've gotta hop over to my Most Wanted List and adjust the rankings on there to reflect these new numbers. HH to all! :sleepy2:
 

boristhespider88

Bronze Member
May 10, 2012
1,947
612
Primary Interest:
Other
Wow!!!! Thanks for the odds!

Can you send a copy of that spreadsheet to me? That's really cool!
 

GMan00001

Silver Member
Dec 19, 2006
2,536
224
Twin Cities, MN
Detector(s) used
Garrett Ace 250
Primary Interest:
All Treasure Hunting
Since you've come this far, why not add a couple of constants that represent your location in the country because in my estimation those will have a big impact on the ability to find certain mintmarks.

If you live on the east coast, "S" mints will appear lower than the predicted number, but on the west coast "S" mints will appear higher than the predicted number.

What I was thinking is the following:
* Add a cell that is the number of coins found from each mint, one for Philadelphia, one for Denver, and one for San Fransisco.
* Now use these percentages these values represent to determine your likelihood of finding a coin minted in Philadelphia, Denver or San Fransisco and with that you can adjust your individual odds of finding a certain mintmark based on your location in the country.
* Optionally do this for all the different varieties (FDR, Merc, Barber, etc).


Note: The values entered in your figure 2 above could optionally be replaced by summing up the values I just mentioned as well.
 

50cent

Silver Member
Nov 16, 2012
2,870
1,109
Super-Skunksville x1000.
Primary Interest:
Other
We use districts not coasts here gman. There is nothing on the coasts but metal detectors, sharks, and scuba divers working for SPECTRE; with that kind of competition, you are unlikely to find a coin from the cisco mint on either coast.


500px-Federal_Reserve_Districts_Map.svg.png
 

OP
OP
Sleepy Holow

Sleepy Holow

Bronze Member
Feb 2, 2013
1,043
876
Expanding Operations
Detector(s) used
Never used one, but am interested
Primary Interest:
Other
If you live on the east coast, "S" mints will appear lower than the predicted number, but on the west coast "S" mints will appear higher than the predicted number.

Of course! That makes total sense, and like you said, is not accounted for in this spreadsheet. Really good input!
 

boristhespider88

Bronze Member
May 10, 2012
1,947
612
Primary Interest:
Other
I wouldn't think that where the coins were minted would make that much of a difference almost 50 years after the silver dimes stopped being minted. That's just me though.

Another interesting variable though.

- DS
 

sjlund

Jr. Member
Dec 18, 2012
91
40
Primary Interest:
All Treasure Hunting
I took a quick look through my roosies - I have one 1949s and several of each of the 1955's out of 535 found and $113,000 searched.
 

GMan00001

Silver Member
Dec 19, 2006
2,536
224
Twin Cities, MN
Detector(s) used
Garrett Ace 250
Primary Interest:
All Treasure Hunting
I wouldn't think that where the coins were minted would make that much of a difference almost 50 years after the silver dimes stopped being minted. That's just me though.

Another interesting variable though.

- DS

I just looked to see how much of a difference it makes for me personally.

Note that my "As Minted" and "Using Circulation Constant" values don't subtract the number of proofs and just use the base mintages.
MintAs MintedUsing Circulation ConstantMy finds
Denver56.2%58.2%72.3%
Philadelphia39.5%38.4%24.4%
San Francisco4.4%3.4%3.2%


For me there is a clear difference based on the mint it was produced at with a significantly higher percentage from Denver and lower percentage from Philadelphia.

Also, taking the extra "Geography Factor" into account indicates that I should expect to complete the 1946-1964 set after finding 908 coins from the set on average. Unfortunately for me, it is taking longer than that. Of course for averages to work out, some people will be lucky and find them faster than that.


I still suspect there is probably some sort of "Collectability Factor" which causes the key and potentially semi-key dates to become harder to find than the typical coins from the set. Just not exactly sure how to quantify it. For example, the 1950-D Jefferson is considered a key date due to its low mintage and I've heard that people knew it was going to be a low mintage coin and hoarded it when it was produced which is why you find so few and why there are so many in great shape.
 

OP
OP
Sleepy Holow

Sleepy Holow

Bronze Member
Feb 2, 2013
1,043
876
Expanding Operations
Detector(s) used
Never used one, but am interested
Primary Interest:
Other
I took a quick look through my roosies - I have one 1949s and several of each of the 1955's out of 535 found and $113,000 searched.

Nice sjlund! If you've got all those, then you must be pretty close to completing the whole set then, huh?
 

cooper36

Hero Member
Nov 30, 2011
912
198
east coast
Primary Interest:
All Treasure Hunting
So I was crunching some numbers concerning the probability of me filling another hole in my FDR folder. So I calculated the probability of a silver FDR find being a certain date and mint. I love taking data and making spreadsheets. All of my data is based on known mintage numbers. The odds of an random silver FDR find being a 1964D are 4:1 while the odds of the same unknown coin being a 1955 are a staggering 529:1.

Some known sources of error include people hoarding key dates, 1964 dimes having had the least amount of time to disappear in the 1946-1964 set, and not actually knowing how many of each date/mint are still in existence.

If you add up the probabilities of finding each hole left on the Most Wanted List, it comes out to about a 10.83% chance of finding one of them each time I come across a silver FDR. Not too bad...8:1 odds. So all I've got to do is find 9 dimes and I should be able to fill a hole! Or at least that's what was supposed to happen. I haven't been able to fill a hole for about a month now. That's no new FDR finds in the last 45 Silver FDRs. Well, if we take into account that there's an 89.17% chance that the found FDR is a duplicate, then the probability of this occurring 45 times in a row is 0.8917^45, or 173:1 odds. By my calculations, that's crazy unlucky! Hmmm..173:1 is good enough to break into the Top 15 toughest silver FDRs odds. Do I have a Top 15 Dime coming this week? Maybe, maybe not, BUT MAYBE! You never know what the next box will bring my friends...HH :sleepy2:


View attachment 839850
For Your Viewing Pleasure: Silver FDR Dime Probability Chart

Sorry Sleepy I hate math and the math makes my head hurt!I do know that I get on avg about 1 dime per box and got 4 dime in 160.00 CRW last week.
HH Cooper
 

Top Member Reactions

Users who are viewing this thread

Top