satalite images

ffmurray

Greenie
Aug 1, 2016
17
26
new mexico
Primary Interest:
Prospecting
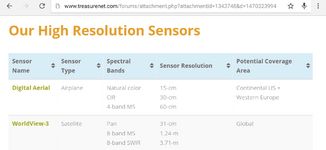
I took a look at the same area in the santa fe national forest with a couple of different satellite imaging services. With each service I was zoomed in as far as I could get in roughly the same part of the creek.

Here are the samples in no particular order:

MapQuest
satalite mapquest.PNG

hometownlocator
hometown locator.PNG

google
google.PNG

bing
bing.PNG

mapbox (via gaiagps.com)
satalite mapbox.PNG

Are there any other good sources that I am missing?

For those of you that use satellite images to find good areas, what sort of methods do you use, any tips/tricks or suggested reading would be great. Im just getting into prospecting, and I always love learning new things.
 

Last edited:
Upvote 0
OP
OP
F

ffmurray

Greenie
Aug 1, 2016
17
26
new mexico
Primary Interest:
Prospecting
OP
OP
F

ffmurray

Greenie
Aug 1, 2016
17
26
new mexico
Primary Interest:
Prospecting
After my last post I decided to go find out some facts and present them with sources to get the correct information out there.

While the WorldView-3 provides 31 cm(~12 inch) panchromatic resolution[SUB](1)[/SUB]Google Maps does seem to get most of its satellite images from LandSat 8[SUB](2)[/SUB]. Landsat 8 has a panchromatic resolution of 15 meters[SUB](3)[/SUB]. It gets Most of its aerial images from the USDA[SUB](4)[/SUB] but it does accept submissions from outside parties if they have better images than is already displayed[SUB](5)[/SUB]. Aerial imagery with resolution with a resolution of 3 inches is available[SUB](6)[/SUB](at quite the cost I'm sure[SUB](no source)[/SUB])

Sources
1: https://directory.eoportal.org/web/eoportal/satellite-missions/v-w-x-y-z/worldview-3
2: Google Maps Gets a New, 700-Trillion-Pixel Cloudless Satellite Map - The Atlantic
3: http://pubs.usgs.gov/fs/2012/3066/fs2012-3066.pdf
4: http://blogs.usda.gov/2011/12/02/usda-a-leader-in-aerial-photography-mapping-for-u-s-agricultue/
5: https://maps.google.com/help/maps/mapcontent/imagery/index.html
6: High Resolution Aerial Photos
 

Clay Diggins

Silver Member
Nov 14, 2010
4,885
14,257
The Great Southwest
Primary Interest:
Prospecting
After my last post I decided to go find out some facts and present them with sources to get the correct information out there.

While the WorldView-3 provides 31 cm(~12 inch) panchromatic resolution[SUB](1)[/SUB]Google Maps does seem to get most of its satellite images from LandSat 8[SUB](2)[/SUB]. Landsat 8 has a panchromatic resolution of 15 meters[SUB](3)[/SUB]. It gets Most of its aerial images from the USDA[SUB](4)[/SUB] but it does accept submissions from outside parties if they have better images than is already displayed[SUB](5)[/SUB]. Aerial imagery with resolution with a resolution of 3 inches is available[SUB](6)[/SUB](at quite the cost I'm sure[SUB](no source)[/SUB])

Panchromatic is black and white (single band) imaging - not color. Neither Google, bing nor Land Matters use black and white image mapping.

Landsat 8 best color images (bands 4,3,2) have 30 meter (~100 foot) resolution per pixel. A 32 pixel block at 100 foot per pixel is a minimum recognizable image of 102,400 square feet - a bit less than 1/2 mile resolution.

The Aerial imaging at 3 inches is from an airplane - not a satellite. I have the bills to prove that it is very expensive. :sad10:

That's the correct information about available satellite imaging. Your facts are correct. If you leave out the stuff about panchromatic images and aerial images you have a pretty good handle on modern satellite images used in web maps. :thumbsup:

Heavy Pans
 

Last edited:

Clay Diggins

Silver Member
Nov 14, 2010
4,885
14,257
The Great Southwest
Primary Interest:
Prospecting
I looked up the worldview-3 satalite
they have some sample images available in 0.31 meter(12.2047 inch) resolution

one of their sample images from WorldView-3 Satellite Imagery and Satellite Sensor Specifications | Satellite Imaging Corp
View attachment 1344155

the full resolution is available from the website

The color image you show here is 1.24 - 1.38 meter resolution (54 inch resolution - the maximum available from satellite as I already wrote in my previous post).

The black and white (panchromatic) images are the ones offered at 0.31 meter(12.2047 inch) resolution.

Heavy Pans
 

chlsbrns

Bronze Member
Mar 30, 2013
1,636
656
Detector(s) used
Excalibur II
Primary Interest:
Other
The color image you show here is 1.24 - 1.38 meter resolution (54 inch resolution - the maximum available from satellite as I already wrote in my previous post).

The black and white (panchromatic) images are the ones offered at 0.31 meter(12.2047 inch) resolution.

Heavy Pans

Airplane - 15cm

Satelite - 31cm
 

Attachments

  • Screenshot_20160805-195623.png
    Screenshot_20160805-195623.png
    83.4 KB · Views: 75
OP
OP
F

ffmurray

Greenie
Aug 1, 2016
17
26
new mexico
Primary Interest:
Prospecting
The color image you show here is 1.24 - 1.38 meter resolution (54 inch resolution - the maximum available from satellite as I already wrote in my previous post).

The black and white (panchromatic) images are the ones offered at 0.31 meter(12.2047 inch) resolution.

Heavy Pans

I didn't notice before because I was looking at the full resolution image and didnt make it down to the lower left hand corner, but it does state there that the resolution is 40cm GSD. So GSD is ground sample distance and is the distance between the pixles, I guess Im not really getting how that translates into 1.25 meter resolution.
 

OP
OP
F

ffmurray

Greenie
Aug 1, 2016
17
26
new mexico
Primary Interest:
Prospecting
Airplane - 15cm

Satelite - 31cm

If you look at the reference in my previous post there are airplane images with ~8cm resolution, and clay diggins is right the 31 cm is panchromatic or black and white only, and mapping companies dont use these ones. but in the image that I posted that is full color from the worldview-3 satellite that you referenced is listed at 40 cm resolution
 

Clay Diggins

Silver Member
Nov 14, 2010
4,885
14,257
The Great Southwest
Primary Interest:
Prospecting
I didn't notice before because I was looking at the full resolution image and didnt make it down to the lower left hand corner, but it does state there that the resolution is 40cm GSD. So GSD is ground sample distance and is the distance between the pixles, I guess Im not really getting how that translates into 1.25 meter resolution.

The 40 cm GSD is only the onboard sensor resolution for one band (black and white). As I pointed out before due to circle of confusion (and several other factors) a color image will be always lower resolution than a single band black and white (panchromatic) image under the same conditions.

In the second paragraph of the page you linked to is the following resolution statement about the satellite images available:
WorldView-3 provides 31 cm panchromatic resolution, 1.24 m multispectral resolution, 3.7 m short wave infrared resolution and 30 m CAVIS resolution.

Your best possible color resolution is 1.24 meters.

Further down the page in the specs is the full resolution statement:
Sensor Resolution ( or GSD, Ground Sample Distance; off-nadir is geometric mean)
  • Panchromatic Nadir: 0.31 m GSD at Nadir 0.34 m at 20° Off-Nadir
  • Multispectral Nadir: 1.24 m at Nadir, 1.38 m at 20° Off-Nadir
  • SWIR Nadir: 3.70 m at Nadir, 4.10 m at 20° Off-Nadir (Commercial delivery at 7.5m resolution)
  • CAVIS Nadir: 30.00 m

Clearly the best color resolution you can count on is 1.38 meters = 54.33 inches. Which coincidentally is the maximum resolution the U.S. government allows for public use of color satellite images. Just the same maximum available resolution I have stated several times in this thread. :BangHead:

If you really have an interest in the meaning of GSD in satellite imaging here's a brief beginners paper on spatial resolution to get you started. As you will see sensor resolution is only a very small part of the resolution equation.

Educate yourself and prosper! :thumbsup:

Heavy Pans
 

Last edited:

winners58

Bronze Member
Apr 4, 2013
1,729
4,058
Oregon
Primary Interest:
All Treasure Hunting
the resolution is getting better, how close I can get and still have focus is what I care about.
.
in this USDA image the closest I can zoom into is 3000ft with out getting too blurry.
USDA.jpg
.
In this newest image I can zoom as close as 1000ft, getting much better.
Landsat.jpg
.
this is the resolution I would like to have access to.
NSA_image.jpg
.
.
.
.
.
.
Ya... DJI Phantom 4 drone.
.
from; https://youtu.be/E81eiZFgcX8
 

Last edited:
OP
OP
F

ffmurray

Greenie
Aug 1, 2016
17
26
new mexico
Primary Interest:
Prospecting

Clay Diggins

Silver Member
Nov 14, 2010
4,885
14,257
The Great Southwest
Primary Interest:
Prospecting
the resolution is getting better, how close I can get and still have focus is what I care about.
.
in this USDA image the closest I can zoom into is 3000ft with out getting too blurry.
View attachment 1344346
.
In this newest image I can zoom as close as 1000ft, getting much better.
View attachment 1344347

More of the USGS aerial images get updated to 12 inch resolution every year. As you pointed out the 12 inch is way better than the 118 inch (3 meter) and 39 inch (1 meter) it's replacing.

Here is 12 inch resolution streaming aerial interactive map from the USGS. This is our standard aerial image layer on Land Matters. You may have to zoom in or out, depending on your window size, to get to 100%.

Feel free to zoom in or move around to see what real free 12 inch aerial resolution looks like then compare it to the paid 54 inch resolution of the World View 3 satellite image here:

View attachment 1344155

Kind of makes you wonder why anyone would pay big money for such low resolution when the free stuff is 4 1/2 times higher resolution? The answer to that is found in those other images World View 3 is producing. The 26 other spectral bands. The World View 3 satellite wasn't put up there to produce better ground pictures it was put up to sell all those invisible wavelengths to researchers trying to prove the forests are dying, the climate is changing, the oceans are polluted and the atmosphere has holes in it. Big worldwide government money in that stuff. :sadsmiley:

Heavy Pans
 

Last edited:

Clay Diggins

Silver Member
Nov 14, 2010
4,885
14,257
The Great Southwest
Primary Interest:
Prospecting
Thanks for taking the time to educate someone as thick skulled as me, I'll get it eventually:laughing7:

You are welcome Jack. Glad I could help.

No one who is actually looking for answers is thick skulled. As long as you seek knowledge you are on the smart list. :thumbsup: It's only those who don't care about the real answers but instead just want to prove they are right that are thick skulled.

Keep on asking questions and looking for the answers and you will be forever young. :laughing7:

Heavy Pans
 

OP
OP
F

ffmurray

Greenie
Aug 1, 2016
17
26
new mexico
Primary Interest:
Prospecting
Keep on asking questions

Ok, well changing gears a little bit to the second part of the question I first asked, regarding how to best use the maps that are available.

When I am looking at claim maps on myLandMatters I see the boxes that cover the areas with claims.
like this
myLandMattersPlacerQuestion.PNG

On some of them it says one claim and on some it says two, but the boxes remain the same size. So do the boxes actually represent the whole area of the claim, or is it just a reference area with the claims defined further somewhere else?

Thanks for the help
 

winners58

Bronze Member
Apr 4, 2013
1,729
4,058
Oregon
Primary Interest:
All Treasure Hunting
thats one section (640 acres) if you select the "i" identify the claim record will say NW, NE, SW, SE,(160 acres) they break them down further into aliquot parts
as in N half, S half, E half or W half so NWSW (40 acres) is in the SW corner and is
as close as you get from BLM record, to see the full description you would look it up at the county recorder.
a description of a 20 acre claim would look like "the N1/2 of the NW1/4 of the SW1/4" of sec. 5 township 32S range 5W of arizona meridian
.
http://www.blm.gov/or/programs/minerals/files/section.pdf
 

Last edited:

KevinInColorado

Gold Member
Jan 9, 2012
7,037
11,370
Summit County, Colorado
Detector(s) used
Grizzly Goldtrap Explorer & Motherlode, Gold Cube with trommel or Banker on top, Angus Mackirk Expedition, Gold-n-Sand Xtream Hand pump
Primary Interest:
Prospecting
The other tricky bit is when you get to the county. Each county has a way of filing and indexing the documents recorded there. Unless you know which pieces of data are used, you may be unable to find the claim fling. Simple solution: call and ask!
 

Clay Diggins

Silver Member
Nov 14, 2010
4,885
14,257
The Great Southwest
Primary Interest:
Prospecting
Ok, well changing gears a little bit to the second part of the question I first asked, regarding how to best use the maps that are available.

When I am looking at claim maps on myLandMatters I see the boxes that cover the areas with claims.
like this
View attachment 1344749

On some of them it says one claim and on some it says two, but the boxes remain the same size. So do the boxes actually represent the whole area of the claim, or is it just a reference area with the claims defined further somewhere else?

Thanks for the help

Winners58 gave you the correct answer. Each box represents a Section which is most often (but not always) a square mile. The "i" tool will give you the details on each claim with links to the Serial Register page with the claim history and details. You can get more information about the Public Land Survey System (PLSS) that defines those sections in the Land Matters Tutorials pages. There are videos and papers there that go into detail on the PLSS and determining land status.

The Mining Claims Map page that links you to the mining claims maps has some brief but important instructions about just what is on the maps and how to use them.

The mining claims represented on these maps are only displayed to the nearest section and DO NOT display the actual claim location. Sections are about one square mile and actual mining claim locations can vary considerably from their mapped location.

The only way to determine an actual claim location is to obtain the County Recorder Location Notice and amendments for the claim in question, study the mapped location and then find the location marker on the ground. Members of the public and other prospectors do not have the right to determine whether and existing claim location is valid, only a court of record can make that determination.

In addition there is a link on that same page to a Land Matters video explaining how to use the mining claims maps.

Click Here for Mining Claims Map Video Tutorial

There is more information on the Mining Claims Maps page. I would suggest you read the entire page and view the video as well as reading the mapping tools instructions found by clicking on the "HELP" button at the top of your mapping window. Your time on the maps will be much more productive if you do those things and most, if not all, of your questions will be answered there. Once you have learned the basic use of the mining claims maps feel free to ask more questions here on this thread, by PM or by using the contact form found on every Land Matters web page.

Heavy Pans
 

Top Member Reactions

Users who are viewing this thread

Top