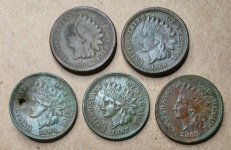
Average inflation adjusted silver price since 1964 = $14.41

TreasurePirate69

Hero Member
Jan 20, 2012
589
196
Primary Interest:
All Treasure Hunting
Just another data point. Take it or leave it. This data implies that the average inflation adjusted yearly price of silver since 1964 is $14.41. The average for gold is $638.31. Note that this is the average of looking at the inflation adjusted price from every single year since 1964. It is not just the inflation adjusted price for a single year (since 1964 that number would be $9.56). Some years add significantly to the average, while others bring the average way down. One thing to note is that out of 48 years worth of data, only 9 of them are over $20 (with most of those being in the late 70's/early 80's and fairly recently).

It's also interesting to look at the inflated prices for 1980. They are almost dead on where we are at today or have been recently for silver, gold, and oil. Coincidence? Was the fear/inflation/global unrest of that period similar to what we see now? Are we doomed to repeat the '80s and return to low $20's soon? I wish I had the answers. Only time will tell. :icon_scratch:

Year
Inflation
Factor

Silver Price
2012 Inflated
Silver Price

Gold Price
2012 Inflated
Gold Price

Oil Price
2012 Inflated
Oil Price

1964

7.39​

$1.29​

$9.56​

$35.10​

$259.39​

$3.00​

$22.17​
1965

7.27​

$1.29​

$9.40​

$35.12​

$255.32​

$3.01​

$21.88​
1966

7.07​

$1.29​

$9.14​

$35.13​

$248.37​

$3.10​

$21.92​
1967

6.86​

$2.06​

$14.13​

$34.95​

$239.76​

$3.12​

$21.40​
1968

6.58​

$1.96​

$12.89​

$39.31​

$258.66​

$3.18​

$20.92​
1969

6.24​

$1.81​

$11.28​

$41.28​

$257.59​

$3.32​

$20.72​
1970

5.90​

$1.64​

$9.65​

$36.02​

$212.52​

$3.39​

$20.00​
1971

5.66​

$1.39​

$7.89​

$40.62​

$229.91​

$3.60​

$20.38​
1972

5.48​

$1.98​

$10.83​

$58.42​

$320.14​

$3.60​

$19.73​
1973

5.16​

$3.14​

$16.19​

$97.39​

$502.53​

$4.75​

$24.51​
1974

4.65​

$4.39​

$20.42​

$154.00​

$716.10​

$9.35​

$43.48​
1975

4.26​

$4.09​

$17.40​

$160.86​

$685.26​

$12.21​

$52.01​
1976

4.03​

$4.35​

$17.52​

$124.74​

$502.70​

$13.10​

$52.79​
1977

3.78​

$4.71​

$17.79​

$147.84​

$558.84​

$14.40​

$54.43​
1978

3.51​

$5.93​

$20.81​

$193.40​

$678.83​

$14.95​

$52.47​
1979

3.16​

$21.79​

$68.87​

$306.00​

$966.96​

$25.10​

$79.32​
1980

2.78​

$16.39​

$45.57​

$615.00​

$1,709.70​

$37.42​

$104.03​
1981

2.52​

$8.43​

$21.25​

$460.00​

$1,159.20​

$35.75​

$90.09​
1982

2.37​

$10.58​

$25.08​

$376.00​

$891.12​

$31.83​

$75.44​
1983

2.30​

$9.12​

$20.98​

$424.00​

$975.20​

$29.08​

$66.88​
1984

2.21​

$6.69​

$14.79​

$361.00​

$797.81​

$28.75​

$63.54​
1985

2.13​

$5.89​

$12.54​

$317.00​

$675.21​

$26.92​

$57.34​
1986

2.09​

$5.36​

$11.21​

$368.00​

$769.12​

$14.44​

$30.18​
1987

2.02​

$6.79​

$13.72​

$447.00​

$902.94​

$17.75​

$35.86​
1988

1.94​

$6.11​

$11.85​

$437.00​

$847.78​

$14.87​

$28.85​
1989

1.85​

$5.54​

$10.25​

$381.00​

$704.85​

$18.33​

$33.91​
1990

1.75​

$4.07​

$7.12​

$383.51​

$671.14​

$23.19​

$40.58​
1991

1.68​

$3.91​

$6.57​

$362.11​

$608.34​

$20.20​

$33.94​
1992

1.63​

$3.71​

$6.05​

$343.82​

$560.43​

$19.25​

$31.38​
1993

1.59​

$4.97​

$7.90​

$359.77​

$572.03​

$16.75​

$26.63​
1994

1.55​

$4.77​

$7.39​

$384.00​

$595.20​

$15.66​

$24.27​
1995

1.50​

$5.15​

$7.72​

$383.79​

$575.69​

$16.75​

$25.13​
1996

1.46​

$4.73​

$6.91​

$387.81​

$566.20​

$20.46​

$29.87​
1997

1.43​

$5.95​

$8.50​

$331.02​

$473.36​

$18.64​

$26.66​
1998

1.41​

$5.55​

$7.82​

$294.24​

$414.88​

$11.91​

$16.79​
1999

1.38​

$5.22​

$7.20​

$278.98​

$384.99​

$16.56​

$22.85​
2000

1.33​

$4.95​

$6.58​

$279.11​

$371.22​

$27.39​

$36.43​
2001

1.29​

$4.37​

$5.64​

$271.04​

$349.64​

$23.00​

$29.67​
2002

1.27​

$4.60​

$5.84​

$309.73​

$393.36​

$22.81​

$28.97​
2003

1.25​

$4.88​

$6.09​

$363.38​

$454.23​

$27.69​

$34.61​
2004

1.21​

$6.67​

$8.07​

$409.72​

$495.76​

$37.66​

$45.57​
2005

1.17​

$7.32​

$8.56​

$444.74​

$520.35​

$50.04​

$58.55​
2006

1.14​

$11.55​

$13.16​

$603.46​

$687.94​

$58.30​

$66.46​
2007

1.10​

$13.38​

$14.72​

$695.39​

$764.93​

$64.20​

$70.62​
2008

1.06​

$14.99​

$15.89​

$871.96​

$924.28​

$91.48​

$96.97​
2009

1.07​

$14.67​

$15.70​

$972.35​

$1,040.41​

$53.48​

$57.22​
2010

1.05​

$20.19​

$21.20​

$1,224.53​

$1,285.76​

$71.21​

$74.77​
2011

1.02​

$35.12​

$35.82​

$1,571.52​

$1,602.95​

$87.04​

$88.78​
Sum

$691.46​

$30,638.90​

$2,100.97​
Avg

$14.41​

$638.31​

$43.77​
 

jim4silver

Silver Member
Apr 15, 2008
3,662
495
Just another data point. Take it or leave it. This data implies that the average inflation adjusted yearly price of silver since 1964 is $14.41. The average for gold is $638.31. Note that this is the average of looking at the inflation adjusted price from every single year since 1964. It is not just the inflation adjusted price for a single year (since 1964 that number would be $9.56). Some years add significantly to the average, while others bring the average way down. One thing to note is that out of 48 years worth of data, only 9 of them are over $20 (with most of those being in the late 70's/early 80's and fairly recently).

It's also interesting to look at the inflated prices for 1980. They are almost dead on where we are at today or have been recently for silver, gold, and oil. Coincidence? Was the fear/inflation/global unrest of that period similar to what we see now? Are we doomed to repeat the '80s and return to low $20's soon? I wish I had the answers. Only time will tell. :icon_scratch:

YearInflation
Factor
Silver Price2012 Inflated
Silver Price
Gold Price2012 Inflated
Gold Price
Oil Price2012 Inflated
Oil Price
1964
7.39​
$1.29​
$9.56​
$35.10​
$259.39​
$3.00​
$22.17​
1965
7.27​
$1.29​
$9.40​
$35.12​
$255.32​
$3.01​
$21.88​
1966
7.07​
$1.29​
$9.14​
$35.13​
$248.37​
$3.10​
$21.92​
1967
6.86​
$2.06​
$14.13​
$34.95​
$239.76​
$3.12​
$21.40​
1968
6.58​
$1.96​
$12.89​
$39.31​
$258.66​
$3.18​
$20.92​
1969
6.24​
$1.81​
$11.28​
$41.28​
$257.59​
$3.32​
$20.72​
1970
5.90​
$1.64​
$9.65​
$36.02​
$212.52​
$3.39​
$20.00​
1971
5.66​
$1.39​
$7.89​
$40.62​
$229.91​
$3.60​
$20.38​
1972
5.48​
$1.98​
$10.83​
$58.42​
$320.14​
$3.60​
$19.73​
1973
5.16​
$3.14​
$16.19​
$97.39​
$502.53​
$4.75​
$24.51​
1974
4.65​
$4.39​
$20.42​
$154.00​
$716.10​
$9.35​
$43.48​
1975
4.26​
$4.09​
$17.40​
$160.86​
$685.26​
$12.21​
$52.01​
1976
4.03​
$4.35​
$17.52​
$124.74​
$502.70​
$13.10​
$52.79​
1977
3.78​
$4.71​
$17.79​
$147.84​
$558.84​
$14.40​
$54.43​
1978
3.51​
$5.93​
$20.81​
$193.40​
$678.83​
$14.95​
$52.47​
1979
3.16​
$21.79​
$68.87​
$306.00​
$966.96​
$25.10​
$79.32​
1980
2.78​
$16.39​
$45.57​
$615.00​
$1,709.70​
$37.42​
$104.03​
1981
2.52​
$8.43​
$21.25​
$460.00​
$1,159.20​
$35.75​
$90.09​
1982
2.37​
$10.58​
$25.08​
$376.00​
$891.12​
$31.83​
$75.44​
1983
2.30​
$9.12​
$20.98​
$424.00​
$975.20​
$29.08​
$66.88​
1984
2.21​
$6.69​
$14.79​
$361.00​
$797.81​
$28.75​
$63.54​
1985
2.13​
$5.89​
$12.54​
$317.00​
$675.21​
$26.92​
$57.34​
1986
2.09​
$5.36​
$11.21​
$368.00​
$769.12​
$14.44​
$30.18​
1987
2.02​
$6.79​
$13.72​
$447.00​
$902.94​
$17.75​
$35.86​
1988
1.94​
$6.11​
$11.85​
$437.00​
$847.78​
$14.87​
$28.85​
1989
1.85​
$5.54​
$10.25​
$381.00​
$704.85​
$18.33​
$33.91​
1990
1.75​
$4.07​
$7.12​
$383.51​
$671.14​
$23.19​
$40.58​
1991
1.68​
$3.91​
$6.57​
$362.11​
$608.34​
$20.20​
$33.94​
1992
1.63​
$3.71​
$6.05​
$343.82​
$560.43​
$19.25​
$31.38​
1993
1.59​
$4.97​
$7.90​
$359.77​
$572.03​
$16.75​
$26.63​
1994
1.55​
$4.77​
$7.39​
$384.00​
$595.20​
$15.66​
$24.27​
1995
1.50​
$5.15​
$7.72​
$383.79​
$575.69​
$16.75​
$25.13​
1996
1.46​
$4.73​
$6.91​
$387.81​
$566.20​
$20.46​
$29.87​
1997
1.43​
$5.95​
$8.50​
$331.02​
$473.36​
$18.64​
$26.66​
1998
1.41​
$5.55​
$7.82​
$294.24​
$414.88​
$11.91​
$16.79​
1999
1.38​
$5.22​
$7.20​
$278.98​
$384.99​
$16.56​
$22.85​
2000
1.33​
$4.95​
$6.58​
$279.11​
$371.22​
$27.39​
$36.43​
2001
1.29​
$4.37​
$5.64​
$271.04​
$349.64​
$23.00​
$29.67​
2002
1.27​
$4.60​
$5.84​
$309.73​
$393.36​
$22.81​
$28.97​
2003
1.25​
$4.88​
$6.09​
$363.38​
$454.23​
$27.69​
$34.61​
2004
1.21​
$6.67​
$8.07​
$409.72​
$495.76​
$37.66​
$45.57​
2005
1.17​
$7.32​
$8.56​
$444.74​
$520.35​
$50.04​
$58.55​
2006
1.14​
$11.55​
$13.16​
$603.46​
$687.94​
$58.30​
$66.46​
2007
1.10​
$13.38​
$14.72​
$695.39​
$764.93​
$64.20​
$70.62​
2008
1.06​
$14.99​
$15.89​
$871.96​
$924.28​
$91.48​
$96.97​
2009
1.07​
$14.67​
$15.70​
$972.35​
$1,040.41​
$53.48​
$57.22​
2010
1.05​
$20.19​
$21.20​
$1,224.53​
$1,285.76​
$71.21​
$74.77​
2011
1.02​
$35.12​
$35.82​
$1,571.52​
$1,602.95​
$87.04​
$88.78​
Sum
$691.46​
$30,638.90​
$2,100.97​
Avg
$14.41​
$638.31​
$43.77​


Before I begin, I mean no offense to the poster of this chart by my comments. But the figures it displays are not truly representative of what the "real inflation" numbers are. Here is the problem with the figures on this chart: it relies on what is known as the CPI inflation rate. CPI measures what is called "core inflation". Using CPI rates, a person can calculate inflation values on the US Dept. of Labor website which has a handy "calculator" that you can use to enter different years and see what said dollar value is worth today. But using CPI figures does not include the rise in food and energy prices, which many believe to show more "inflation" than anything else. The CPI rate excludes food and energy prices, which is why many don't put much faith in the CPI numbers. When you stop and think which items we buy today seem to have the biggest increase in prices it is exactly that, food and energy.

Having said that, I will say I do believe that gold and silver have risen beyond what their "worth" was in 1964 even taking whatever the "real" inflation value should be. This is because both have become valued as "investments" during this bull market over the past 11 years and I believe will rise even faster in the future relative to the inflation rate, whatever that is.
That is why when someone tells you that a dozen eggs will cost $10 when silver reaches $100 (or some similar example) it is pure baloney, in that it is highly possible and probable that the rise in gold and silver prices will outpace inflation due to investment demand that will be huge (especially during the final phase of the bull market; the "mania" phase as it is called).

Just my opinion.

Jim
 

OP
OP
T

TreasurePirate69

Hero Member
Jan 20, 2012
589
196
Primary Interest:
All Treasure Hunting
Jim. No offense taken. I totally agree that the CPI inflation values are suspect. However, just how far off they are is probably something that we can approximate. Even if the inflation is off by a factor of 2 (which would be huge so I can't imagine that the situation is that bad), the inflation adjusted price of silver would still only be around $28 which is FAR from the often quoted value of $100+ that many bloggers/bulls tend to quote. Food and energy are nowhere near that level of "real" inflation today.

Again, take it or leave it. My point here is to shed some light on "inflation adjusted silver prices". Many people take the highest historical silver price from 1980 and inflate it to come up with the highest possible historical inflated price point. However, if you look at the other 47 of the possible 48 years since 1964, the inflation adjusted price is nowhere near that number. The typical response is that those other 47 years must be manipulated prices. Yet the 1980 price is the one that we know for SURE was manipulated due to the Hunt brothers. So it doesn't make much sense to me to throw out 47 years of prices just to get the benefit of hand picking the one specific year that had a highly manipulated price (all the while claiming that manipulation is the cause of the "down" years).

Just an observation I came up with after thinking more about inflation adjusted prices. The price from here could go up or it could go down. If it goes up, it sure won't be because the inflation adjusted price dictates it. If people are putting stock in claims that the inflation adjusted price should be over $100, then they need to look at this chart and make up their own minds.
 

Last edited:
OP
OP
T

TreasurePirate69

Hero Member
Jan 20, 2012
589
196
Primary Interest:
All Treasure Hunting
The answer to that question is "who knows?". I've stopped stacking for now. But I will likely regret it later.

I'm just pointing out that there are a lot of common misconceptions being spewed by those who have a vested interest in making everyone believe that silver has nowhere to go but up. I see a lot of stackers who scoff at the idea of sub-$20 silver five years from now. But if these numbers are any indication, we could potentially be reliving the late '70s all over again. Keep in mind that back then we had the same massive inflation, global uncertainty (Iran), oil/gas shortages, and many other things that caused prices to soar. I'm sure that back then there were stackers that were making similar grand claims about where silver was going to go. And there were surely those that believed there was no solution to the world's problems and that stacking was their only hope at salvation. However, history (and this chart) tells us that they were (at least temporarily) wrong. Within 10 years silver was back down in the $6 range.

Although past performance does not guarantee future results, I think one would be wise to take many of the claims made today by silver bulls with a grain of salt. I used to believe the $100+ inflated silver claims. That is, until I did my own research. Now when I hear someone claiming that silver should be over $100 due to inflation I tune them out. They are either lying or clueless. Either way it doesn't bode well for them. A similar thing can be said about the mystical 16:1 gold to silver ratio (but that will be the topic of another post). :laughing7:
 

jim4silver

Silver Member
Apr 15, 2008
3,662
495
I agree that trying to value silver today based on inflation and comparing it to 1964 prices is not a good gauge of future performance. One reason is that back in 1964 there was far much more above ground silver that existed than today. Not only in bullion form but up till then all US quarters, halves and dimes were silver. So the value of silver then compared to now is difficult to show because it was being used as a currency and was all over the place. Thus, we have a supply and demand situation that alone is more relevant than using the inflation rate when trying to find out how much silver should be worth today.

But having said that, what I believe will propel silver above $100 (and I am not a kool aid drinking silver bug) is the coming and currently occurring currency debasement. All the QEs will have an effect on the dollar's value in spite of what the QE proponents say. Silver is going to gain traction as institutional traders (hedge funds, etc) jump in as well as average folks who will show interest, probably though after the price has gone up far more than it is now.

One thing to keep in mind is that the US is not the only place where the currency/debt situation is out of hand. Look at Europe and other countries around the world and similar things are going on or will happen later. People in other countries are generally far more advanced when it comes to the idea of wealth preservation by use of PMs than Americans. Look at India, China, and some countries today in the Euro, where the common man on the street is far more likely to know the value of gold and silver bullion than the average American.

The good thing (?) about gold and silver is that there is probably not much more than a few billion $$$$$ worth available to buyers in physical form at any given time, yet there are many Trillions worth of paper investments floating around. If even a small portion of said paper were to find its way into physical, it will be gone quickly. This will happen later, when who knows?

Anyone doubting the future value of PMs can simply look at history to see where we are headed. It has happened before many times that a country/society starts out using PMs or a backed currency of some sort to slowly devolve over time into using a pure fiat currency. The result of such an "experiment" is always the same-- the fiat currency eventually gets to its intrinsic value of zero.


Jim
 

OP
OP
T

TreasurePirate69

Hero Member
Jan 20, 2012
589
196
Primary Interest:
All Treasure Hunting
Jim, I think the problem that I have is with believing that "this time is really it". I'm sure that back in the '70s people were saying the same things. Inflation was way worse than it is today; Iran, China, and Russia were all powder kegs waiting to explode; gas shortages looked like they would be the death of civilization; and on and on. Slightly different problems than what we have now. But the same basic result. Silver, gold, oil, and many other commodities hit all time highs. People were saying that there was no turning back and that the currency would definitely fail any day now. But what happened? We eventually turned it around. And when we did, all of those PM investors dumped their metals and the price came crashing back down. Those that did not dump their metals lost their shirts. Some of those same people were thoroughly convinced that they were right and that their metals would come roaring back any day now. Some 30 years later they were finally proven to be right. In the meantime, others bought silver at what seems now like ridiculously low prices.

I'm just providing some data points to try and rattle a few brains out here. If it only further increases your convictions about where the price of silver is going, then that's just fine too.
 

Top Member Reactions

Users who are viewing this thread

Top