signumops
Hero Member
- Feb 28, 2007
- 756
- 226
- Detector(s) used
- Garrett, Minelab, Aqua-Pulse
- Primary Interest:
- All Treasure Hunting
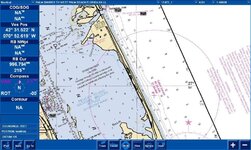
I use MapTech on my laptop coupled with a Garmin 12 XL (no WAAS) as well as several other Garmin GPS units (with WAAS). I have found a way to update the BSB/KAP charts graphically for my own use. See the attached screen shot of a NOAA chart with the contractual boundary of the Cabin Wreck near Sebastian inlet. I have decided to update this particular chart further with all of the boundary files for the entire Fisher holdings as well as some other wreck boundary information. While I am at it, I might add other wreck locations that are fixed properly as the NOAA charts are frequently off by a mile or so in many instances, nor are the wrecks historically ID'd. In other words, this would be a third party compilation of some of the charts. If you use BSB/KAP in your own digital plotter, and you are interested in having your own waypoints/symbols added, I might trade you the finished product for your data.
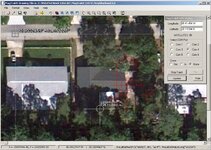
Meanwhile, I have updated MagTrakR with a nominal GPS tracking processor. The NOAA charts are coarse when you are attempting to do something like track yourself while running a magnetometry pattern, so I use custom basemaps with MagTrakR in much higher resolution. Attached a screenshot of MagTrakR using its GPS processor. The pic was snatched from Google Earth... its a shot of my house where I was actually writing the code. I had the Garmin 12XL right about where the cross-circle symbol is shown. The upper left position is the marker set out in Google Earth which I used to geo-reference the photo in MagTrakR world space. The red crosses are the fixes posted from the GPS every 3 seconds or so for a few minutes. The GPS itself was situated near a porch overhang, under a SeaGrape tree, so I did not have a great collection of satellites to work with... I did not have enough serial cable to stretch outside of the house to optimize the GPS receiver position. As you can see, the HDOP (horizontal dilution of precision) was pretty bad as the signal meandered over a 60 foot area, about 50 feet from the true position of the GPS. This would not be the case if I were at sea with an unobstructed view of the satellites.
Meanwhile, I have updated MagTrakR with a nominal GPS tracking processor. The NOAA charts are coarse when you are attempting to do something like track yourself while running a magnetometry pattern, so I use custom basemaps with MagTrakR in much higher resolution. Attached a screenshot of MagTrakR using its GPS processor. The pic was snatched from Google Earth... its a shot of my house where I was actually writing the code. I had the Garmin 12XL right about where the cross-circle symbol is shown. The upper left position is the marker set out in Google Earth which I used to geo-reference the photo in MagTrakR world space. The red crosses are the fixes posted from the GPS every 3 seconds or so for a few minutes. The GPS itself was situated near a porch overhang, under a SeaGrape tree, so I did not have a great collection of satellites to work with... I did not have enough serial cable to stretch outside of the house to optimize the GPS receiver position. As you can see, the HDOP (horizontal dilution of precision) was pretty bad as the signal meandered over a 60 foot area, about 50 feet from the true position of the GPS. This would not be the case if I were at sea with an unobstructed view of the satellites.