1715 Fleet Dig Charts

signumops

Hero Member
Feb 28, 2007
756
226
U.S.
Detector(s) used
Garrett, Minelab, Aqua-Pulse
Primary Interest:
All Treasure Hunting
In the gold bird thread, Scubafinder made mention of the 1715 fleet maps that were originally constructed by the Fishers, now, I guess maintained by Bill Moore working for Queens Jewels. Yes the files are original AutoCAD drawings in DWG format, and it would be nice to have AutoCAD to make use of them, however, they are perfectly usable without AutoCAD. The only drawback is that you can not access the database file indicating what company dug the hole in what year, and what particularly was found.

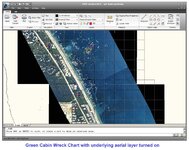
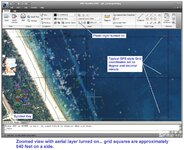
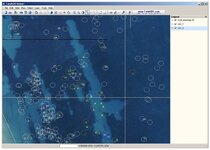
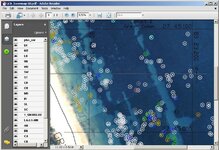
The drawing files are geo rectified, furnished with a concise geocentric grid in degrees minutes and seconds, and overlaid on some really spectacular aerial photos, which were taken during a period of very exceptional sea visibility, making it possible to see the bottom submerged terrain where the excavations have occurred.

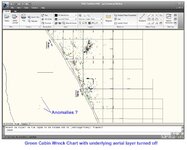
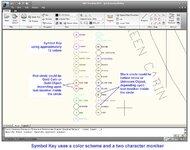
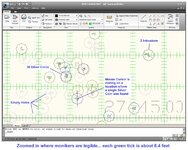
Apparently the project was started when mechanical pen plotters were usually fitted with cartridge carousels with 12 pens, and therefore, to make use of the plotted charts, the symbology for the excavations were circles in 12 colors (or less).

You don’t have to have AutoCAD itself: you can use a freebie from AutoDesk, designed to host DWG and DXF drawing files. This program is called “DWG TrueView”. I use the 2010 edition, “DWG TrueView 2010”.

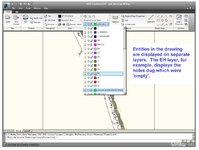
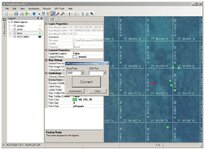
TrueView loads the Fisher basemaps on top of a universal frame that has a Lat/Long grid as a layer. All AutoCAD drawings are based upon the layer design where particular elements of the drawing are stored on different layers. For example, shorelines are one layer, grids are on another layer, and, in the case of these particular maps, all the excavation locations are stored on separate layers, with each layer hosting a given item found in that excavation. Gold coins are symbolized on a single layer, silver coins on another, and ceramics (potsherds) on another, and so forth. There are about 50 layers in these map drawing files. If you have the appropriate software, you can turn layers off and on, including the underlying photo aerial layer.

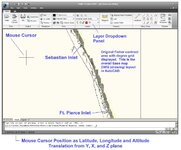
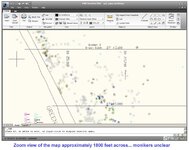
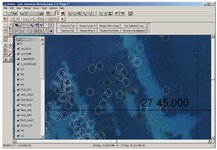
TrueView fully supports the layer utility, AND, it also has dynamic Mouse Cursor coordinate display in the bottom statusbar of the program, so that you can retrieve the geographic locations of any point on the map.

Originally, Fishers actually plotted the maps out for you on a large scale color plotter, and that is what you used to visualize your digs. But, today, you can actually get the DWG file from Bill and use it in TrueView. It is possible to plot out your own area of interest on paper, or to PDF if you have a PDF output utility.

In the illustrations below, you can see the overall grid base layer at full extents in the TrueView viewport. In the second illustration you can see the dropdown layer listing.

Note that TrueView is displaying decimal degree coordinates in its statusbar. Typically, most of us use decimal degree/ decimal minute formats on our GPS units, but, most GPS units can be setup to use decimal degree format, I believe.
 

Attachments

  • PicA.jpg
    PicA.jpg
    142.3 KB · Views: 1,359
  • PicB.jpg
    PicB.jpg
    130.4 KB · Views: 737
OP
OP
signumops

signumops

Hero Member
Feb 28, 2007
756
226
U.S.
Detector(s) used
Garrett, Minelab, Aqua-Pulse
Primary Interest:
All Treasure Hunting
Here is a sample DWG file of the Green Cabin Wreck area shown below with the aerial layer turned on, then the same view port in TrueView with the aerial layer turned off.

Once the aerial is turned off, you can discover some excavation symbols which are positioned back on dry land. How did these get there? Don’t know.

In all probability, the coordinates reported on the daily log sheets were completely off by several digits, or, illegible when they were being processed by the Fishers. At any rate, after using these charts for a number of years, I must applaud the Fishers for furnishing the data, but, I must also caution anyone using the data to be forewarned regarding the accuracy, abundantly illustrated here.

I suppose its remotely possible that somebody actually dug some holes on dry land at one time and reported them to the Fishers, but I kind of doubt it.
 

Attachments

  • PicC.jpg
    PicC.jpg
    182.2 KB · Views: 976
  • PicD.jpg
    PicD.jpg
    130.2 KB · Views: 865
OP
OP
signumops

signumops

Hero Member
Feb 28, 2007
756
226
U.S.
Detector(s) used
Garrett, Minelab, Aqua-Pulse
Primary Interest:
All Treasure Hunting
Using TrueView, you can zoom dynamically into the drawing. When you do, the grid, if turned on, becomes useful at a certain scale. The grid is enumerated in typical GPS style decimal degree and decimal minute. Using the 3 decimal place minute notation, you move about 6.4 feet (at the latitudes in these maps) for each thousandth place in the decimal minute.

The symbol key used by these charts is conveniently plotted repeatedly across the entire range of the Fisher 1715 franchise. In the first illustration below, the symbol key is not of much use as it is lying atop the aerial photo in a densely forested area, however, you need only turn off the aerial layer and zoom down to the symbol key for a clear picture, as shown in the second illustration.

The symbol key is easily understood, but, to make full use of it graphically, you have to be able to see the two character moniker inside of the circle. Otherwise, the color coding can be slightly misleading from a distant view. For example, it is very important to know where ballast stones have been discovered. If you can not read the moniker inside the circle, you would not know whether you were looking at a ballast location, or maybe the location of an unidentified piece of junk, such as an engine block or broken toilet seat, both of which may be reported by an uninterested salvor as “unknown” material.
 

Attachments

  • PicE.jpg
    PicE.jpg
    214.8 KB · Views: 1,015
  • PicF.jpg
    PicF.jpg
    144.8 KB · Views: 712
OP
OP
signumops

signumops

Hero Member
Feb 28, 2007
756
226
U.S.
Detector(s) used
Garrett, Minelab, Aqua-Pulse
Primary Interest:
All Treasure Hunting
As you zoom in here, you can see the many empty holes that have been dug (the light gray symbols), and, if the data is correct, the un-excavated area is also obvious.

In the second illustration, the 1000 grid has been turned on and the monikers in each symbol are clearly legible. Each excavation symbol is about 18 feet in diameter in real world measurements. Each green square measures 64 feet on a side. Using the GPS gear available commercially, positions can only be recorded at three decimal places on the decimal minute, which equates to a distance of 6.4 feet along the Treasure Coast. But, it is possible to record positions in AutoCAD with much, much greater accuracy as must be evident in the second illustration where some positions are only a foot apart.

You could actually use TrueView to print out the view port to paper and mark it up manually during the workday once you had registered the grid, if this was the area you intended to work that day. This beats having to care for a computer on a small workboat.
 

Attachments

  • PicH.jpg
    PicH.jpg
    181.5 KB · Views: 688
  • PicG.jpg
    PicG.jpg
    139.6 KB · Views: 753

Salvor6

Silver Member
Feb 5, 2005
3,755
2,171
Port Richey, Florida
Detector(s) used
Aquapulse, J.W. Fisher Proton 3, Pulse Star II, Detector Pro Headhunter, AK-47
Primary Interest:
Shipwrecks
Thanks Terry that was very informative. I spent a lot of time with Bill Moore when I sub-contracted on the 1715 fleet. He would print out charts for me of selected areas. Its very interesting to see all the blow holes around Corrigans where they found the "carpet of gold." There is still huge areas that have not been explored at all.
 

GOHO

Sr. Member
Apr 13, 2008
299
35
The AutoCAD mapping system is very versital but i am very interested in the Site recorder Software. I download the demo and i will give it some time and check it out!


The Position data from 1996 thru present is of course a GPS centered over the excavation hole and before 1996 we used beach markers and a sextent to measure the angles between 3 of the beach markers. A spread sheet was developed to convert those angles to Florida State planes East NAD83 then we further converted the State Planes to Decimal Degrees for use in the AutoCAD Basemap.

These basemaps were design this way because we excavate in a "HIGH ENERGY ENVIROMENT" with lots of overburden and bad vis. When we excavate using the Mail Box after we idle back, the GPS antena is directly over the round hole we just dug thats down to bedrock. Each artifact that is recovered from that small excavation hole (we scale the excavation hole to match real world size) is tagged and bagged and all attributes of the excavation are recorded in real time and plotted.

The Acad system is linked to a database so every attributes of the artfact can be accessed with a click. Also every artifact can be scaled into the basemap in 3D or hyperlink directly to a photo. we can also create 3D bathymetry surface maps and import our Multibeam, Sidescan, Sub bottom , MAG and EM data into the basemap and overlay it over the wreck site.

I magine that site record has some advantages because its designed just for the type of work we do but the AutoCAD system is very impressive for a bunch of "!x#%&!!! Treasure Hunters !".


I would rather refer to myself personally as a "Historic Shipwreck Salvor" or an "Ancient Shipwreck Explorer".


Alexandre, Thanks for sharing that link!
 

Last edited:

Bum Luck

Silver Member
May 24, 2008
3,482
1,282
Wisconsin
Detector(s) used
Teknetics T2SE, GARRETT GTI 2500, Garrett Infinium
Primary Interest:
All Treasure Hunting
Accuracy and precision is everything. One wonders how those positions are acquired.

Better than Autocad is Site Recorder:

Downloads

there's a lot of publications there that deal with this issue:

3H Publications

I use AutoCad all the time, and if it is precise enough for machine design, it's certainly precise enough for shipwrecks.

Accuracy is a function of the data that goes into it, or any program.
 

GOHO

Sr. Member
Apr 13, 2008
299
35
You can also use a program called 'Global Mapper" to import the ACAD drawing and then connect to your GPS and your driving in real time over the basemap!
 

AUVnav

Sr. Member
Mar 10, 2012
455
86
Primary Interest:
All Treasure Hunting
There is also a product called Open CPN. http://opencpn.org/ocpn/

You need to buy a GPS puck to attach to your laptop, but then you can see you position real-time. Nav Charts are the backround, but you can also use Google Earth or Autocad.
With Civil 3D, everything can be mapped horizontally and vertically, so the point has a depth. When doing a site layout, one can them put in a trench in 3d. Images can be placed on any surface, so make sure that the images are geo-referenced or have a ref point.
Same for artefacts. the exact location and depth can be plotted, as well as a 3d rendering. This can then link back to an external database for the artefacts.
With the chirp profiler, these surfaces can be brought into the terrain basemap.
With the ability to place images from several sources on the 3d surfaces, I have brought in images, chirp surfaces, mag and sidescan all into the basemap.
All of this can be tilted up in 3D to visualize as well.
All of the entities can be exported to Google Earth for other to look at..all in the coordinate system.

Good luck.
 

Last edited:

FISHEYE

Bronze Member
Feb 27, 2004
2,333
401
lake mary florida
Detector(s) used
Chasing Dory ROV,Swellpro Splash 2 pro waterproof drone,Swellpro Spry+ wa,Wesmar SHD700SS Side Scan Sonar,U/W Mac 1 Turbo Aquasound by American Electronics,Fisher 1280x,Aquasound UW md,Aqua pulse AQ1B
Primary Interest:
All Treasure Hunting
How many here that worked or is working the fishers leases gave accurate GPS data on found gold and silver artifacts?What i mean by accurate is not 50 or 100 feet from where you found the item/s.
 

sphillips

Bronze Member
Jan 4, 2008
1,047
1,120
Western NC
Detector(s) used
Equinox 800
Primary Interest:
All Treasure Hunting
There is also a product called Open CPN. OpenCPN | Official OpenCPN Homepage

You need to buy a GPS puck to attach to your laptop, but then you can see you position real-time. Nav Charts are the backround, but you can also use Google Earth or Autocad.
With Civil 3D, everything can be mapped horizontally and vertically, so the point has a depth. When doing a site layout, one can them put in a trench in 3d. Images can be placed on any surface, so make sure that the images are geo-referenced or have a ref point.
Same for artefacts. the exact location and depth can be plotted, as well as a 3d rendering. This can then link back to an external database for the artefacts.
With the chirp profiler, these surfaces can be brought into the terrain basemap.
With the ability to place images from several sources on the 3d surfaces, I have brought in images, chirp surfaces, mag and sidescan all into the basemap.
All of this can be tilted up in 3D to visualize as well.
All of the entities can be exported to Google Earth for other to look at..all in the coordinate system.

Good luck.

Very interesting AUvnav, thanks for the input
 

OP
OP
signumops

signumops

Hero Member
Feb 28, 2007
756
226
U.S.
Detector(s) used
Garrett, Minelab, Aqua-Pulse
Primary Interest:
All Treasure Hunting
Site Recorder is a proprietary package that produces a proprietary data file. This means that you can only share your data with others who have purchased the full edition of the product. They (3H Consulting) also have a ‘viewer’, similar in operational function to Adobe Acrobat, which is the universally accepted plugin for the display of PDF files, commonly distributed across the internet, or used to store data internally for whatever purpose. The 3H viewer can interpret Site Recorder data files. Otherwise, you have to have Site Recorder itself to use the Site Recorder file structure.

Here in the U.S., the Apex company has managed to corner the property appraiser’s assessment report/mapping market with a similar strategy: their product, which performs a function for property inspectors much the same way that Site Recorder does for archaeologists, is proprietary, and you have to spend money to make use of your data, or to record new data.
Apex Software - US

Site Recorder is touted at the home page as….
“The program has been designed by archaeologists for archaeologists so you don’t need to be a computer expert to use it.”…
If you examine the sample projects hosted at the 3H Consulting website, you can see that the data package is just exactly what an archaeologist would want for any wreck that is found sum-total, in situ. The data contained in any of these projects must be in minutiae form to get the type of results illustrated in the samples.

Probably the real Site Recorder selling point for the archaeological buyer’s market can be found at:
3H Consulting

… would we expect anything less?


Meanwhile, the AutoCAD DWG/DXF data file form, and any acceptable common open source database file, including the typical spreadsheet in CSV format, or the well used .dBF format akin to the more widely accepted shapefile, of GIS fame, are widely supported for many commonly used computer programs available for free, in many instances.

In every event, isolating spatial data from GIS systems users on the broad front is a typical ploy of the archaeological community at large. The AutoCAD model, or the ESRI ArcIMS model are much more agreeable, easier to support, and more flexible when combined with other commonly understood digital tools, than any proprietary format could ever hope to be.

3H Consulting claims that they have a method of consolidating and rectifying a datum network which no other software has. This is patently untrue. Adjustment of datum points, via least-squares adjustment has been a part of AutoCAD software and ArcMap for quite a while.

My rant here is focused on the term “common” as opposed to the term “exclusive”.

As for being able to track yourself in real time using a GPS, there are several free software packages that provide that service. My favorite would be Google Earth, but there are some others. Seen below is MapWindow GIS, which is a free program produced by the Univ. of Idaho which supports realtime GPS. The MapWindow software is a typical GIS software that runs like ESRI’s ArcIMS and makes use of shapefiles and DXF files, as well as the JPG aerials.

There’s also a screen shot of the data printed from TrueView in PDF format as the first illustration. As you can see, the layer paradigm carries over to the PDF and it is possible to turn layers off and on by clicking on the layer menu “eye” symbols.

The second and third illustrations show the data in the Tatuk Viewer (a free GIS data viewer from Tatuk GIS in Poland) and in my own software, 2D2GIS. Both packages use the DXF version of the data. You can notice the ellipsoidal contraction of the circle symbols due to the coordinate projection engines used in the different programs.
 

Attachments

  • Image26.jpg
    Image26.jpg
    119.8 KB · Views: 287
  • Image24.jpg
    Image24.jpg
    137.9 KB · Views: 333
  • Image22.jpg
    Image22.jpg
    143.3 KB · Views: 258
  • PDFsnapshot.jpg
    PDFsnapshot.jpg
    106.3 KB · Views: 319
Last edited:

GOHO

Sr. Member
Apr 13, 2008
299
35
Thanks Signumops for that summary.

I looked over the software myself and found it interesting but really more limited than what we can do with the AutoCAD mapping system. I didnt see any features that the software had that really couldnt be done using ACAD but there is much more that ACAD can do than Site Recorder can.

Back about 10 years ago a Sub-contractor working the vessel "Gold Duster" named John Tokkars wrote a VB Application inside of AutoCAD that would read your GPS comm port and move you around on the AutoCAD map screen based on your current position but it needed a little tweeking to make it more user friendly or i would have kept using it.
 

GOHO

Sr. Member
Apr 13, 2008
299
35
How many here that worked or is working the fishers leases gave accurate GPS data on found gold and silver artifacts?What i mean by accurate is not 50 or 100 feet from where you found the item/s.

There have been some sub-contractors that i am sure did not record proper postion either by mistake or maybe a little more sinister but with over 100K records just on Douglas Beach alone the chances of every excavation being recorded in the wrong place are slim and we get a very detailed picture of how these wrecks broke up and scattered for miles down the beach.
 

AUVnav

Sr. Member
Mar 10, 2012
455
86
Primary Interest:
All Treasure Hunting
Another very good use is mapping caves and mines. With Civil 3D, (and good measuring techniques) a cave can be mapped quite nicely. With the inclinometer and a cheap laser tape measure, some very detailed and accurate 3D caves and mines can be made.
Again, images can be mapped to the sides, then turned and rotated for interesting views.
One feature is that the surface location of the underground shafts can be made! AND plotted to Google Earth!

Enjoy
 

Last edited:

PeteH

Newbie
Aug 24, 2010
1
0
Hi chaps,

> As the developer of Site Recorder I thought I'd just add some clarification to what was written here as it may help explain a few things.

Site Recorder is a proprietary package that produces a proprietary data file. This means that you can only share your data with others who have purchased the full edition of the product.

> This is true. Site Recorder (SR4) files are in a proprietary format and they are partly encoded to ensure security of the data and files can also be locked to stop editing, printing and screen grabs. Site Recorder has been used on a number of sensitive projects where it was important that the data does not leak out before it is to be published. This is used by both archaeologists and treasure hunters for the same reasons. When the data is to be shared more widely it can be exported from SR4 format into a number of common data formats to be read into databases, other GIS and the like.

They (3H Consulting) also have a ‘viewer’, similar in operational function to Adobe Acrobat, which is the universally accepted plugin for the display of PDF files, commonly distributed across the internet, or used to store data internally for whatever purpose. The 3H viewer can interpret Site Recorder data files. Otherwise, you have to have Site Recorder itself to use the Site Recorder file structure.

> Also true. The free viewer just means that you have to pay a fee to collect data, by buying an SR4 license, but anyone wishing to look at it can do it for free.

...

Site Recorder is touted at the home page as….
“The program has been designed by archaeologists for archaeologists so you don’t need to be a computer expert to use it.”…
If you examine the sample projects hosted at the 3H Consulting website, you can see that the data package is just exactly what an archaeologist would want for any wreck that is found sum-total, in situ. The data contained in any of these projects must be in minutiae form to get the type of results illustrated in the samples.

> Not true. Site Recorder has been used to record every type of wreck site you can think of. Intact, scattered, deep, shallow, old, modern, whatever. Its also been used to design gardens, for underwater crime scenes and to map dinosaur footprints.

Probably the real Site Recorder selling point for the archaeological buyer’s market can be found at:
3H Consulting

… would we expect anything less?

> No idea, what were you expecting? Its not just a tool for archaeologists, some of my favourite clients are in the commercial sector.


Meanwhile, the AutoCAD DWG/DXF data file form, and any acceptable common open source database file, including the typical spreadsheet in CSV format, or the well used .dBF format akin to the more widely accepted shapefile, of GIS fame, are widely supported for many commonly used computer programs available for free, in many instances.

> If you read the specs on SR4 you can see that data can be output in DXF, CSV etc. Native format provides protection for the data and software that runs on any PC, export formats allow you to share data when *you* want to.

In every event, isolating spatial data from GIS systems users on the broad front is a typical ploy of the archaeological community at large.

> You make the mistake of thinking that this was developed by an archaeologist; I'm an engineer and surveyor who works in both the academic and commercial sector of this business. I just have a lot of fun finding, mapping and excavating wrecks and I needed a tool to make the recording process easier, so I made Site Recorder.

The AutoCAD model, or the ESRI ArcIMS model are much more agreeable, easier to support, and more flexible when combined with other commonly understood digital tools, than any proprietary format could ever hope to be.

> Not true. The data model used in SR4 is much smaller and more portable than any AutoCAD or ESRI product. SR4 will run on very low spec computers found in the possession of most archaeologists unlike most CAD or GIS programs. SR4 does not use a back end database so is easier to install and requires fewer additional resources than either of them too. If you really want to know the staory then there's a few papers you can download from the 3H Consulting web site written about why that approach was chosen when I designed the program.

3H Consulting claims that they have a method of consolidating and rectifying a datum network which no other software has. This is patently untrue. Adjustment of datum points, via least-squares adjustment has been a part of AutoCAD software and ArcMap for quite a while.

> The adjustment tool in SR4 can adjust distance measurements and includes specialist error finding algorithms, whereas most of the other applications I looked at when I made that claim could adjust angles and would distances rather poorly. The maths used for the adjustment is full survey specification, its the same maths used in the leading underwater acoustic positioning system used by the oil industry (as I designed that too). I've not looked at the capabilities of other applications for a while so they may have caught up with their distance measurement adjustment processing.

Also, at that time the tools to do the adjustment were a paid-for add on to the GIS programs whereas in SR4 you can use them for free, as SR4 allows you to use all its of its survey capability for free in the Demo version available online.

My rant here is focused on the term “common” as opposed to the term “exclusive”.

As for being able to track yourself in real time using a GPS, there are several free software packages that provide that service. My favorite would be Google Earth, but there are some others. Seen below is MapWindow GIS, which is a free program produced by the Univ. of Idaho which supports realtime GPS. The MapWindow software is a typical GIS software that runs like ESRI’s ArcIMS and makes use of shapefiles and DXF files, as well as the JPG aerials.

> Site Recorder does this as standard, just plug in a GPS and you can see the boat sailing around over your site plan. It also works with a number of underwater acoustic positioning systems so you can track divers and ROVs on the plan as well.

> Site Recorder can be downloaded for free from the 3H Consulting web site www.3HConsulting.com. The downloaded version runs in Demo mode which has all the features but the numbers of some things you can add are limited, but survey capability is not limited. Installed with the program is a free Exercise Book which includes a number of step-by-step tutorials that teach you to use all of the features in the program using the free Demo version - no training course is needed. Only when you want to go beyond the capabilities in the free version do you need to purchase a license, so a huge amount of underwater survey and recording work is done by enthusiasts at no cost to them at all. Read all about it here: Site Recorder Exercise Book

I don't believe that kind of service is offered by AutoCAD or ESRI.

Regards, Pete


Director, 3H Consulting Ltd
 

Alexandre

Bronze Member
Oct 21, 2009
1,047
435
Lisbon
Hi chaps,

> You make the mistake of thinking that this was developed by an archaeologist; I'm an engineer and surveyor who works in both the academic and commercial sector of this business. I just have a lot of fun finding, mapping and excavating wrecks and I needed a tool to make the recording process easier, so I made Site Recorder.

Director, 3H Consulting Ltd

True. What's more, Pete has a very treasure-hunter-like (or commercial, as he prefers to say) view of underwater cultural management, which causes me to really dislike his ideas and opinions.

That said, I think that Pete's work with SR4 is oustanding. I have worked with SR4 demo version on a river site, and found it not only to be very intuitive to use, but also perfectly adapted to my needs, as an archaeologist that, in that specific case, needed to map and record a wreck in the middle of an almost nil visibility underwater desert plain of sand and silt.

I have a huge project going on and, as soon as I the funds, I will definitely buy SR4.
 

GOHO

Sr. Member
Apr 13, 2008
299
35
PeteH, Thanks for the info.... I did like the structure and flow of Site Recorder and the way everything is linked together. I can see great potential with your software but i need to work with it a little more before i can determine if it would be worth me converting to it. I would need to be able to bring in all of my old data and link it and layer it accordingly... is this possible with Site Recorder? I'm talking 100,000+ records for 1 Site?


I would also like to display my excavation holes in a simular fashion as i do in ACAD and be able to scale them to the correct DIA.. For example... one excavation could be 6' of sand so our exposed bedrock may only be 4' and the next excavation we have 10' exposed.... I Tried to do this in Site Recorder but couldnt find a way...

Like i said.. The software is interesting and Thank You for developing it...
 

Top Member Reactions

Users who are viewing this thread

Top