- Joined
- Mar 19, 2003
- Messages
- 2,712
- Reaction score
- 3,379
- Golden Thread
- 0
- Location
- Washington
- Detector(s) used
- Custom Designs and Prototypes
- Primary Interest:
- All Treasure Hunting
- #281
Thread Owner
I showed a simulation of 100 "guesses" to have the following results:
Hits: 0 1 2 3 4 5
----------------------------------
+/- 0: 74 24 2 0 0 0
+/- 1: 43 37 19 1 0 0
+/- 2: 25 40 27 6 2 0
+/- 3: 16 36 30 12 5 1
These numbers do not exactly match my calculated odds, which were estimations in the first place because of the overwhelming difficulty of doing exact calculations. So what would happen if we perform a second run of 100 guesses? Well, let's see... here's a second set of 100+1 simulations:
Hits: 0 1 2 3 4 5 6
---------------------------------------
+/- 0: 76 23 1 0 0 0 0
+/- 1: 45 39 10 5 1 0 0
+/- 2: 33 38 15 12 0 2 0
+/- 3: 21 37 22 13 4 2 1
There are some things of interest... first, there is a success of 6 guesses at the +/-3 error level, which is the threshold for Sandsted. Second, while some of the numbers are pretty close to the first run (76-23-1 vs 74-24-2 for exact guessing) some are radically different. Notice in the first run that for +/-2 there were 2 correct guesses 27 times, but in the second run this only happened 15 times.
Why is this so, and which number is "correct"? Statistically, they are both correct. This is what happens when you look at a relatively small sample of data... there can be anomalies that skew our perception of what's going on. Ferinstance, in the first set there were no successes of 6 correct. Should I therefore assume that it would be impossible to guess correctly 6 times? Of course not! This is why a simple "pre-test" in which a dowser purely guesses is a poor benchmark... it does not provide nearly enough information as to how likely particular outcomes are. And this is why we use statistical calculations.
If we combine the data from these 2 runs, we will then have 200 simulations which will provide a more accurate picture of the distributions. But let's go even further... let's combine 10 runs, or 1000 simulations:
Hits: 0 1 2 3 4 5 6 7
----------------------------------------------------------------------
+/- 0: 76.00 21.30 2.50 0.10 0.10 0.00 0.00 0.00
+/- 1: 46.60 36.30 13.50 3.00 0.60 0.00 0.00 0.00
+/- 2: 30.00 37.60 21.80 8.10 2.20 0.30 0.00 0.00
+/- 3: 19.20 32.60 28.80 13.1 5.50 0.60 0.20 0.00
Numbers are percentage levels. Now you can see that in 1000 sims, there were 2 sims in which 6 hits occured at the +/-3 level. So you can see that even though one 6-hit occured in the first 200 sims, only one more occured in the next 800 sims.
Back to my calculations:
Hits: 0 1 2 3 4 5 6 7
----------------------------------------------------------------------
+/- 0: 77.63 19.91 2.30 0.16 0.01 0.00 0.00 0.00
+/- 1: 45.86 37.18 13.57 2.93 0.42 0.04 0.00 0.00
+/- 2: 26.31 37.58 24.16 9.20 2.30 0.39 0.05 0.00
+/- 3: 14.61 30.98 29.57 16.73 6.21 1.58 0.28 0.03
These numbers correlate pretty well with the cumulative 1000 sims, though some of the numbers appear to be diverging a bit at the +/-3 level. This doesn't surprise me in the least, as the calculation become progressively more quirky as you allow more and more variance in the guesses. In any case, the calculations are more than sufficient as a statistical baseline to which dowsing can be compared.
Finally, here are the histograms for the 1000-run total:
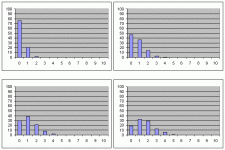
Seeing the distributions as plots provides an easier way look at the trends, and helps show how means and spreads are shifting as we loosen up the test requirements.
- Carl
Hits: 0 1 2 3 4 5
----------------------------------
+/- 0: 74 24 2 0 0 0
+/- 1: 43 37 19 1 0 0
+/- 2: 25 40 27 6 2 0
+/- 3: 16 36 30 12 5 1
These numbers do not exactly match my calculated odds, which were estimations in the first place because of the overwhelming difficulty of doing exact calculations. So what would happen if we perform a second run of 100 guesses? Well, let's see... here's a second set of 100+1 simulations:
Hits: 0 1 2 3 4 5 6
---------------------------------------
+/- 0: 76 23 1 0 0 0 0
+/- 1: 45 39 10 5 1 0 0
+/- 2: 33 38 15 12 0 2 0
+/- 3: 21 37 22 13 4 2 1
There are some things of interest... first, there is a success of 6 guesses at the +/-3 error level, which is the threshold for Sandsted. Second, while some of the numbers are pretty close to the first run (76-23-1 vs 74-24-2 for exact guessing) some are radically different. Notice in the first run that for +/-2 there were 2 correct guesses 27 times, but in the second run this only happened 15 times.
Why is this so, and which number is "correct"? Statistically, they are both correct. This is what happens when you look at a relatively small sample of data... there can be anomalies that skew our perception of what's going on. Ferinstance, in the first set there were no successes of 6 correct. Should I therefore assume that it would be impossible to guess correctly 6 times? Of course not! This is why a simple "pre-test" in which a dowser purely guesses is a poor benchmark... it does not provide nearly enough information as to how likely particular outcomes are. And this is why we use statistical calculations.
If we combine the data from these 2 runs, we will then have 200 simulations which will provide a more accurate picture of the distributions. But let's go even further... let's combine 10 runs, or 1000 simulations:
Hits: 0 1 2 3 4 5 6 7
----------------------------------------------------------------------
+/- 0: 76.00 21.30 2.50 0.10 0.10 0.00 0.00 0.00
+/- 1: 46.60 36.30 13.50 3.00 0.60 0.00 0.00 0.00
+/- 2: 30.00 37.60 21.80 8.10 2.20 0.30 0.00 0.00
+/- 3: 19.20 32.60 28.80 13.1 5.50 0.60 0.20 0.00
Numbers are percentage levels. Now you can see that in 1000 sims, there were 2 sims in which 6 hits occured at the +/-3 level. So you can see that even though one 6-hit occured in the first 200 sims, only one more occured in the next 800 sims.
Back to my calculations:
Hits: 0 1 2 3 4 5 6 7
----------------------------------------------------------------------
+/- 0: 77.63 19.91 2.30 0.16 0.01 0.00 0.00 0.00
+/- 1: 45.86 37.18 13.57 2.93 0.42 0.04 0.00 0.00
+/- 2: 26.31 37.58 24.16 9.20 2.30 0.39 0.05 0.00
+/- 3: 14.61 30.98 29.57 16.73 6.21 1.58 0.28 0.03
These numbers correlate pretty well with the cumulative 1000 sims, though some of the numbers appear to be diverging a bit at the +/-3 level. This doesn't surprise me in the least, as the calculation become progressively more quirky as you allow more and more variance in the guesses. In any case, the calculations are more than sufficient as a statistical baseline to which dowsing can be compared.
Finally, here are the histograms for the 1000-run total:
Seeing the distributions as plots provides an easier way look at the trends, and helps show how means and spreads are shifting as we loosen up the test requirements.
- Carl