signumops
Hero Member
- #1
Thread Owner
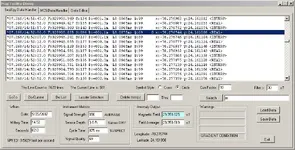
I'm writing software to post-process Marine Magnetics mag log files. This would be for the SeaSpy magnetometer. I need some more data files to debug the application. The application actually parses the data and plots the magnetic signals, by strength along their track lines. The application drives the signals to the map based upon fluctuation from the ambient field average strength and drops a symbol on the map indicating the positive (red) or negative (green) adjusted for symbol size depending upon the intensity of the gammas at that point.
I would like to have more data to analyze while debugging, and if you have some data that you would like to have mapped, PM me and we can make arrangements. I can plot the data and return a PDF print of the plot to you. I will not share your data without consent, however, if you would like a plot, please be certain that the data is yours to give. Thanks for all assistance!
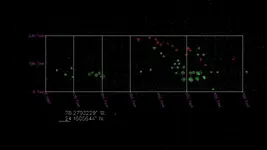
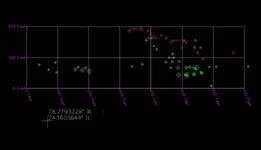
I have attached a screen shot of a typical plot along with a shot of the data handler dialog for the software. This dataset was filtered for 30 gammas, so all pings measuring less than 30 gammas are originally portrayed as dots while all pings greater than 30 gammas are portrayed as red or green symbols. The larger the symbol, the greater the gamma strength. I can turn off the negligible symbols as well, as illustrated.
By the way, the messier the data, the better! You must have been using a GPS with your unit at the time, in order for the mapping to work. Otherwise I can't map your hits.
I would like to have more data to analyze while debugging, and if you have some data that you would like to have mapped, PM me and we can make arrangements. I can plot the data and return a PDF print of the plot to you. I will not share your data without consent, however, if you would like a plot, please be certain that the data is yours to give. Thanks for all assistance!
I have attached a screen shot of a typical plot along with a shot of the data handler dialog for the software. This dataset was filtered for 30 gammas, so all pings measuring less than 30 gammas are originally portrayed as dots while all pings greater than 30 gammas are portrayed as red or green symbols. The larger the symbol, the greater the gamma strength. I can turn off the negligible symbols as well, as illustrated.
By the way, the messier the data, the better! You must have been using a GPS with your unit at the time, in order for the mapping to work. Otherwise I can't map your hits.
Amazon Forum Fav 👍


Attachments
Last edited: